UOPEOPLE FACTSHEET
Student Demographics and Outcomes
Overview
At University of the People, our mission is to offer an accessible, quality education to any qualified student through flexible, affordable, online, accredited degree-granting programs that give graduates the potential to lead successful, fulfilling lives as individuals and members of society.
Countries & Territories
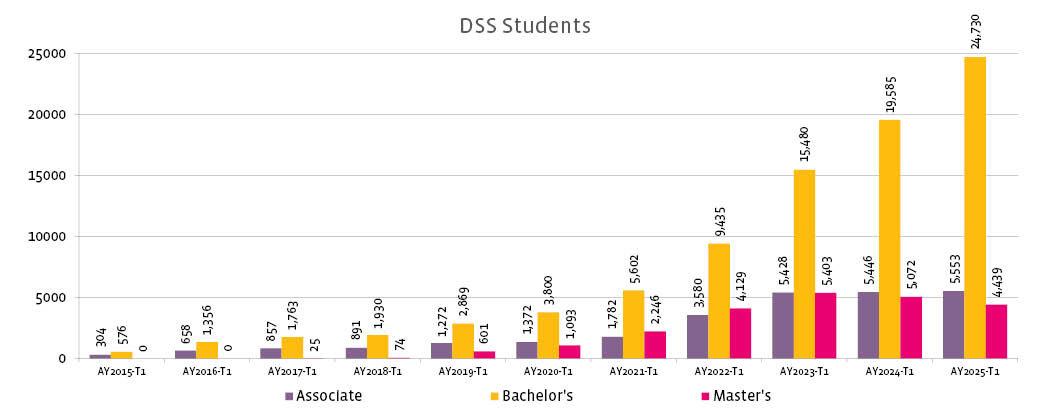
Total Students
Students are refugees
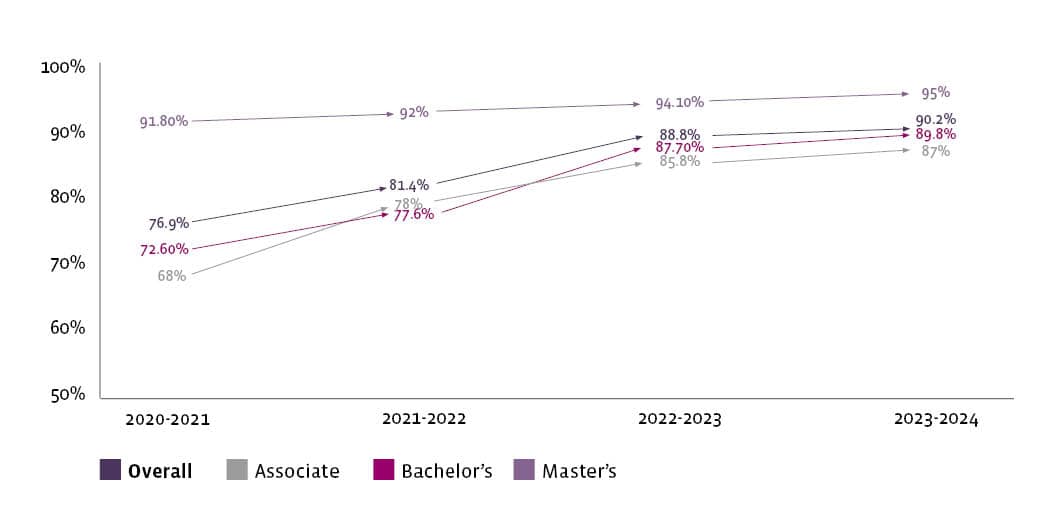
Retention Rate
*Statistics provided here reflect First Day data for AY2025, as of September 6, 2024.
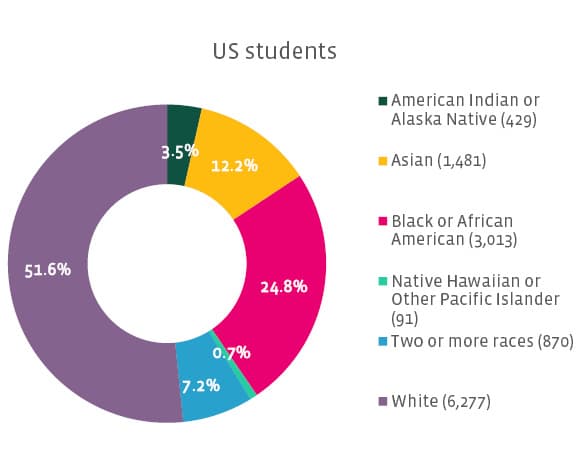
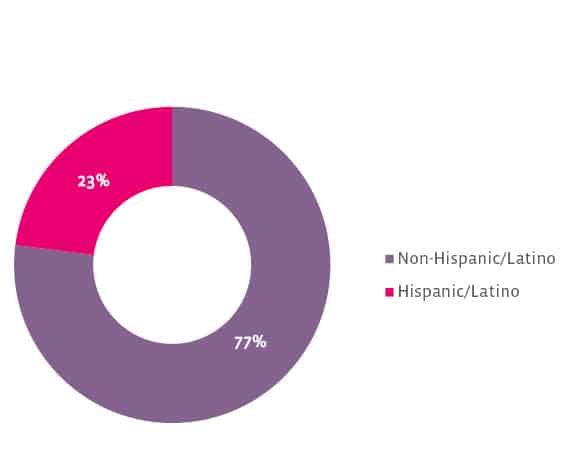
Student Demographics
Our Students
Our students are an incredible mix of passionate, dedicated individuals from around the world. Most are working adults, many of whom are also raising families while they study.
of students have
children
of students are
first-generation
college students
*Source: Student Demographic Survey, Q. Do you have any children? AY2024, Total Respondents: 3.4k
Student Demographic Survey, Q. What is the highest level of education completed by (at least one of) your parents?, AY2024, Total Respondents: 3k
Retention Rates
Data is key to improving our understanding of how we can best support our students and help them overcome the challenges they are facing. It also helps to identify what’s working by viewing improvements over time, as you can see in our retention rates.
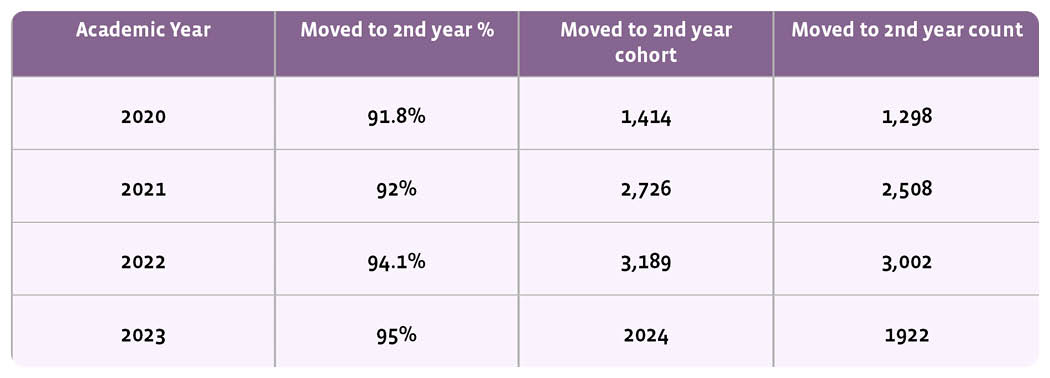
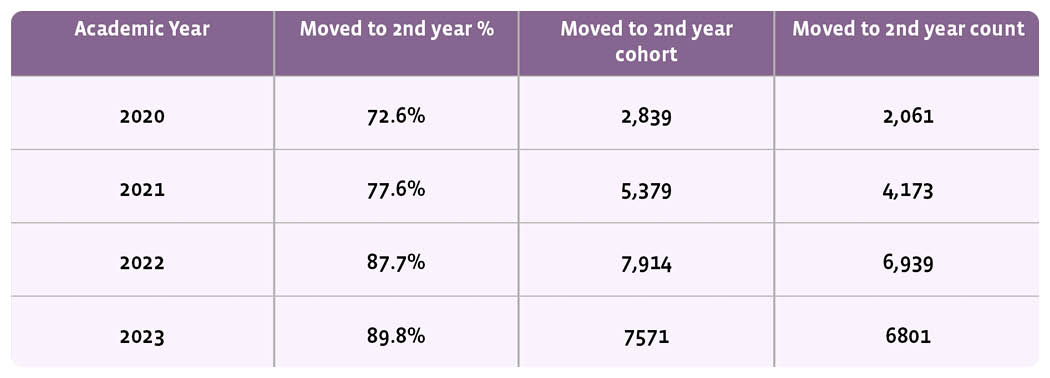
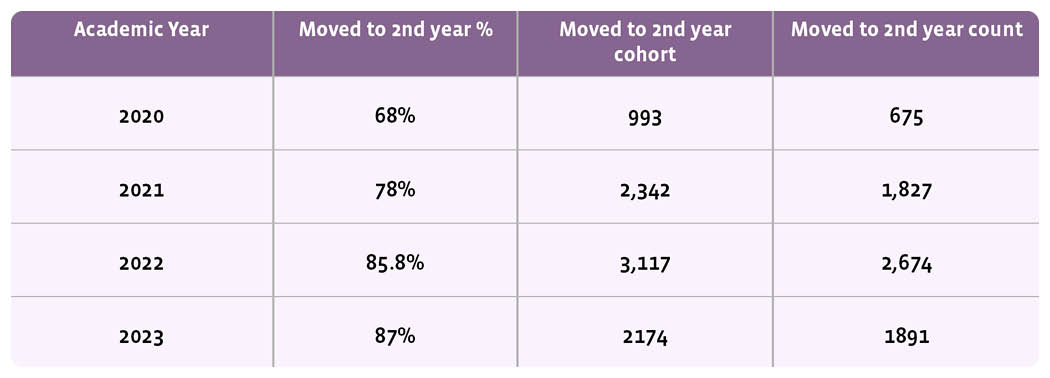
YEAR ONE RETENTION RATES BY PROGRAM LEVEL
*First to second year retention rates of degree-seeking students
Based on DSS students' first term in the DSS program, students are grouped based on whether they were enrolled/On Hold day 1 an academic year later or not. An average % is calculated for each academic year. (ESL and Certificate Students are excluded.)
The tables below show the total number of degree-seeking students from each cohort who have moved on to their second year, by program.
Master’s
Bachelor’s
Associate
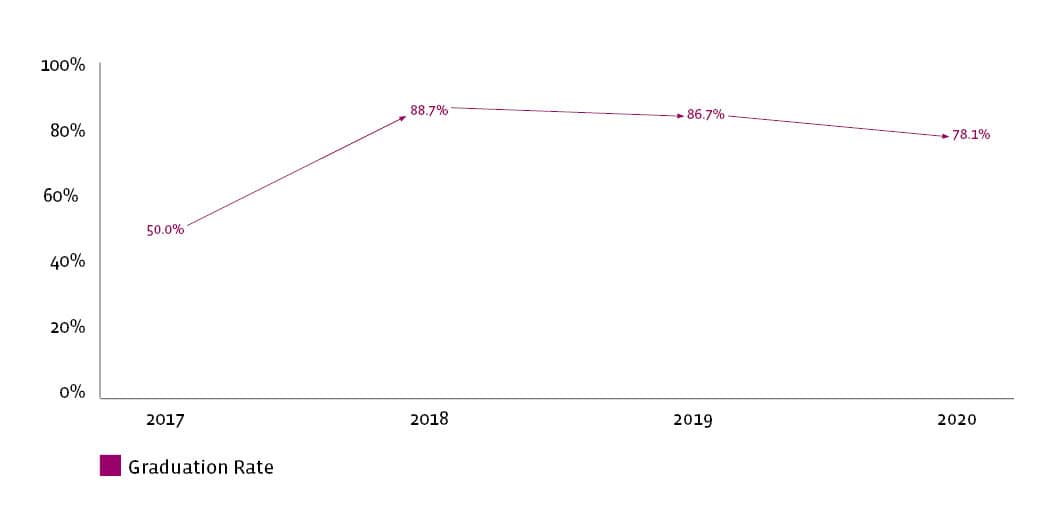
Graduation Rates
Thousands of students have graduated from UoPeople and are using what they’ve learned to lead promising careers. We’re proud of our graduates and being able to prepare them for real world success.
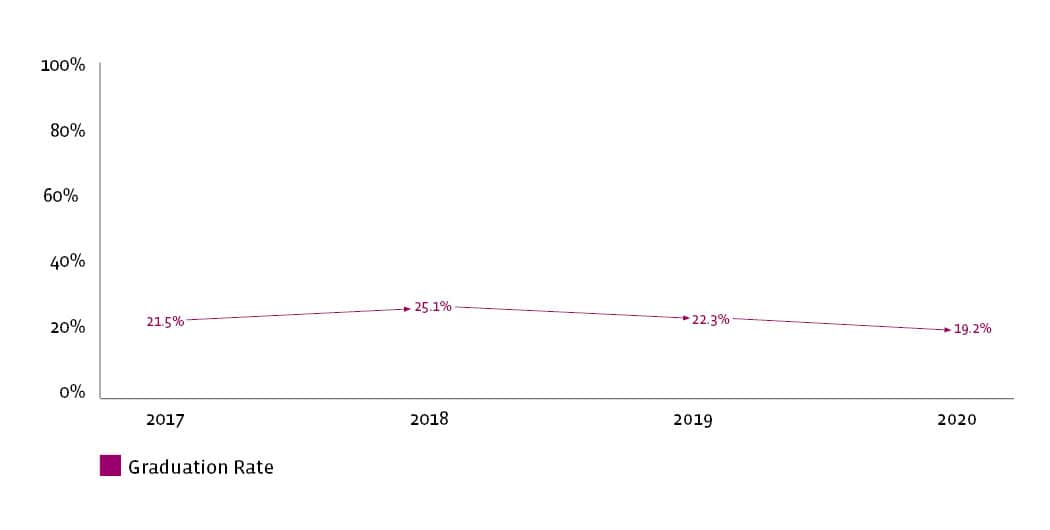
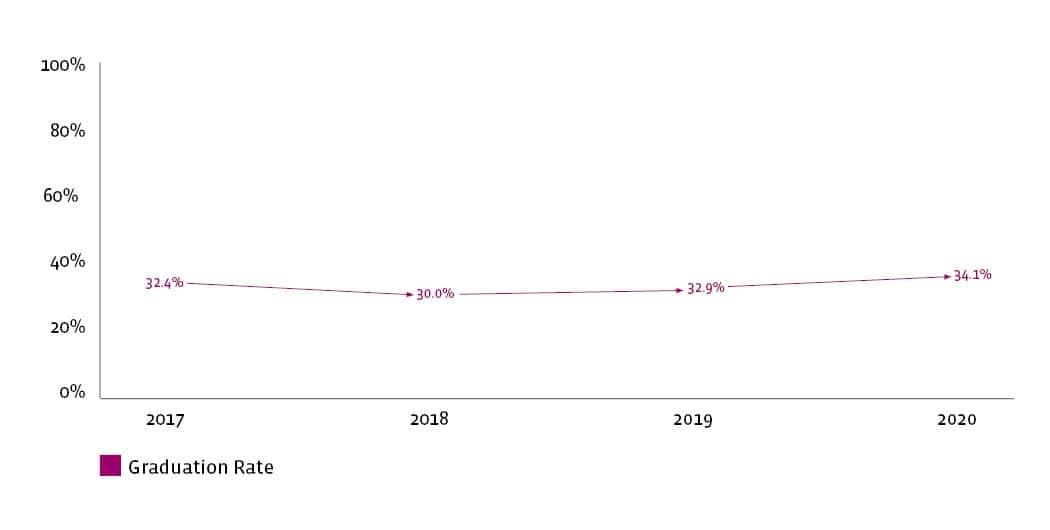
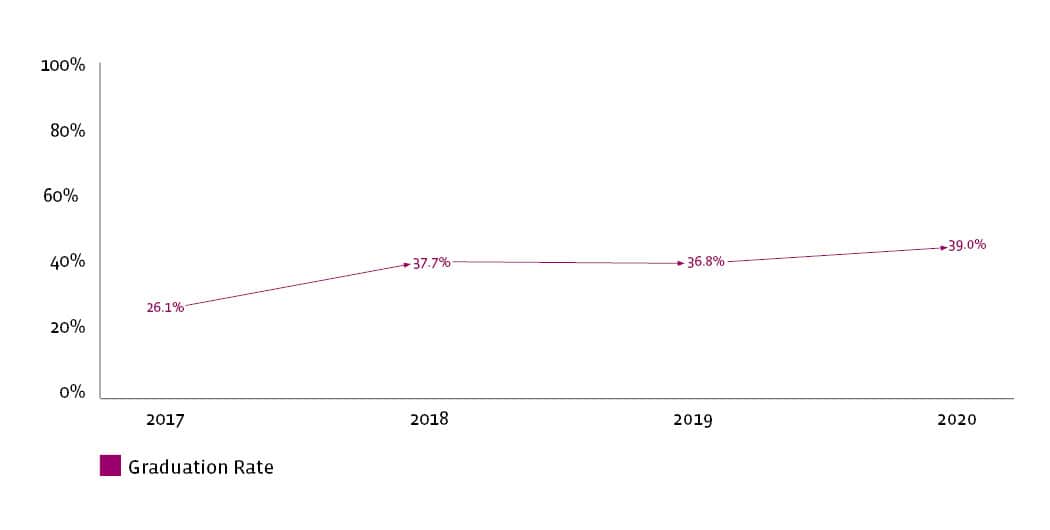
The below show graduation rates for all degree-seeking students, across all program areas. Graduation rate is defined as the percentage of students completing their program within a time period equal to three times (300%) the normal period of time, the maximum time allowed by UoPeople policy.
Master’s Degree Students
Bachelor’s Degree Students
Associate’s Degree Students
All Degree Seeking Students
*Source: Students enrolled in courses as 1st time DSS (Week5) across all programs.
Student Satisfaction
We place a strong emphasis on student experience and continual improvement. As part of this mission, we conduct a a detailed student and alumni survey each academic year to capture impressions and feedback from our diverse group of learners.
of students are
proud to study
at UoPeople
of alumni would
recommend UoPeople
to a friend
of students say they feel
a sense of personal
accomplishment
of students feel their
instructors are helpful
and supportive
of students say they were
taught career centric skills
and knowledge
of students feel they are
treated with respect
of Alumni feel UoPeople prepared them for their current career
of Alumni are
employed
are Executives or
Managers
Sources:
Student Alumni Survey. AY2023, Total Respondents: 3,337
Student Experience Survey, AY2024
Total Respondents: 12,258
Detailed Reporting
Here we offer our IPEDS data, which we augment with our own definitions elsewhere on this website in order to more accurately reflect our student body's experience. We also share our Student Learning Outcomes Assessment Strategy and analyses. Finally, we share results from our Program Assessment Report.


